
Section outline
-
Course Teacher
Fouzia Akter
Assistant Professor
Department of Nutrition and Food Engineering
Mobile Number:+880 1820-000810
Email:fouzia@daffodilvarsity.edu.bd
Requirements: Please follow these instructions throughout the course!!!
- All the materials and tasks for this course have been provided in the BLC.
- Please go through all these lessons one by one.
- Please feel free to ask any questions on the discussion Forum after every lesson.
- Try to read out all answers/comments/posts including yours.
- Compare your thoughts with others and remark on your mistake.
- All enrolled students should complete their activity in BLC for the accomplishment of this course.
- Your activity in BLC will be highly appreciated.
- Develop your skill which will be helpful for your carrier development.
-
Students mustMark as done
A. Course Description
Basic concepts of descriptive statistics, probability, statistical inference, regression, correlation analysis
B. Course Objectives
The objectives of this course are:
- Understand basic concepts of descriptive statistics, mean, proportion median, standard deviation.
- Draw simple graphs – bar charts, histogram, pie chart, line graph, box-plot.
- Produce frequency tables.
- Understand basic probability concepts.
- Understand and use Binomial, Normal, and Students t distributions.
- Be able to compute point and interval estimates of the population mean and proportion.
- Understand and test hypotheses about the population mean and proportion.
- Compute and test for the linear relationships between two variables.
-
Students mustMark as done
Assessment Strategy
- Quiz 15
- Presentation 8
- Assignment 5
- Mid Term 25
- Final Term 40
- Class Attendance 7
-
Students mustMark as done
Course Code: 0542-2109 Semester:Spring 2024 Course Title: Biostatistics
Course Level: L2 T1 Credit: 3 (Three)
-
Students mustMark as done
-
Students mustMark as done
-
Students mustMark as done
Assessment Strategy
- Quiz
- Presentation
- Assignment
- Homework
- Mid Term
- Final Term
Teaching Strategy
- Presentation
- Discussion
- Question answer session
- BLC
-
Students mustMark as done
-
Statistics is the science of data. It's about collecting, analyzing, interpreting, and presenting data
to make informed decisions. Think of it as a toolbox with many different tools (mathematical
formulas and methods) that can be used to understand and make sense of the world around us.-
Students mustMark as done
-
Students mustMark as done
-
Students mustMark as done
-
-
When we talk about the presentation of data, we are referring to the process of showcasing information in a way that is visually appealing and can be easily comprehended. This involves using various tools and techniques to display data in a clear and concise manner, such as graphs, charts, tables, and infographics. The goal of presenting data is to make it easier for the audience to interpret and analyze the information being presented, which can be especially important when dealing with complex or large sets of data. A well-designed presentation of data can help to highlight key insights and trends, making it easier for decision-makers to draw conclusions and take action based on the information provided.
-
Students mustMark as done
-
Students mustMark as done
-
Students mustMark as done
-
-
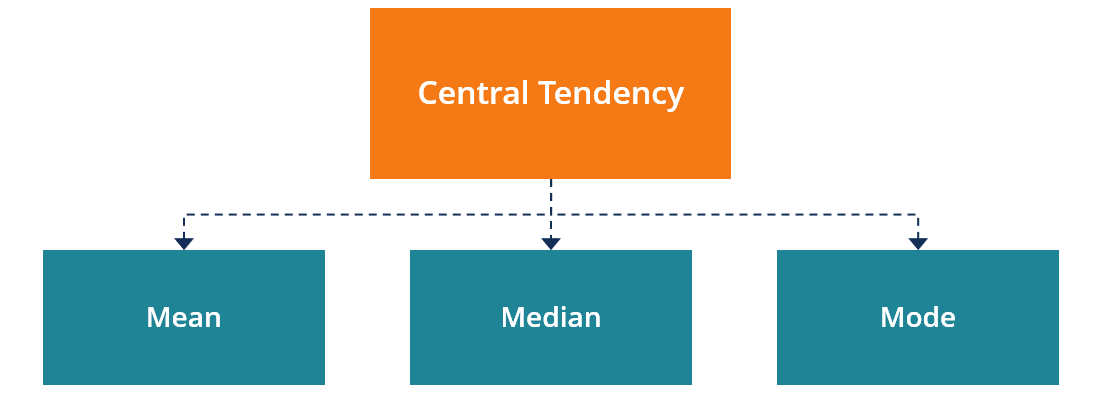
Summary:
In statistics, a central tendency is a central or typical value for a probability distribution. Colloquially, measures of central tendency are often called averages. The term central tendency dates from the late 1920s. The most common measures of central tendency are the arithmetic mean, the median, and the mode.
-
Students mustMark as done
-
Students mustMark as done
-
Students mustMark as done
-
-
Measures of dispersion describe the spread of the data. They include the range, interquartile range, standard deviation, and variance. The range is given as the smallest and largest observations. This is the simplest measure of variability.-
Students mustMark as done
-
Students mustMark as done
-
-
Dear Students,
Please post any questions you have about the midterm syllabus, and I will answer them here for you.-
Students mustMark as done
-
-
Discussion Forum for Variables
-
-
Probability is simply how likely something is to happen. Whenever we're unsure about the outcome of an event, we can talk about the probabilities of certain outcomes—how likely they are. The analysis of events governed by probability is called statistics.
-
Students mustMark as done
-
Students mustMark as done
-
Students mustMark as done
Problem 1: There are 12 patients in a hospital ward. All of them are male. 8 patients have renal disease and 3 patients have liver disease. Among the 12 patients, 1 patient has both diseases. Find Probability of renal disease given that the patient also has liver disease.
Problem 2: In a bag, there are 4 white balls, 7 green balls, and 12 yellow balls. If 4 balls are picked, what is the probability of picking yellow ball first, white ball second, green ball third, and again yellow ball for the fourth time?
-
Students mustMark as done
-
-
Hypothesis testing is a form of statistical inference that uses data from a sample to draw conclusions about a population parameter or a population probability distribution.
-
Students mustMark as done
-
Due: Sunday, 15 December 2024, 8:19 PMStudents mustMark as done
-
-
Presentation
Mandatory Guidelines for Data Collection:
1. One student must collect data from ten other students (these ten students are known as respondents).
2. Five respondents should be female, and the other five should be male.
3. Five respondents should be from public universities, and the other five should be from private. (All respondents should be bachelor's students).
4. ONE RESPONDENT SHOULD FILL UP ONLY ONE FORM.
5. THE RESPONDENT MUST WRITE YOUR REFERENCE ID (last three digits of your ID) IN THE GOOGLE FORM.
6. You cannot collect data from NFE students.
7. Data should be collected only from students who are studying in Dhaka.The data collection and Experience submission deadline is 15 December 2025, 23:59 pm.
The link to the Google Form:
https://docs.google.com/forms/d/e/1FAIpQLSfGJGentsVdCNZd5wPDnEXIuSqwygDQoGH3dwJjUISROI5wCw/viewform?usp=sf_link
-
Opened: Tuesday, 3 December 2024, 12:00 AMDue: Sunday, 15 December 2024, 11:59 PMStudents mustMark as done
-
-
-
Students mustMark as done
-
-
-
Correlation is a key statistical measure that describes the degree of association between two variables. There are three basic types of correlation: positive correlation: the two variables change in the same direction. negative correlation: the two variables change in opposite directions.

-
Students mustMark as done
-
Students mustMark as done
-
Students mustMark as done
-
Students mustMark as done
-
-
Summary:
The most commonly used techniques for investigating the relationship between two quantitative variables is linear regression. regression expresses the relationship in the form of an equation.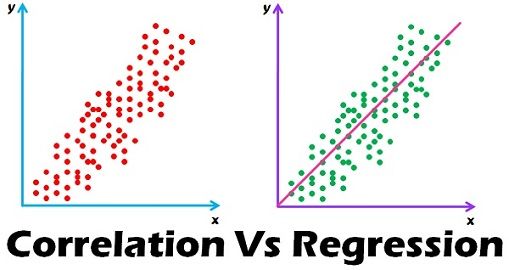
-
Students mustMark as done
-
Students mustMark as done
-
Students mustMark as done
-